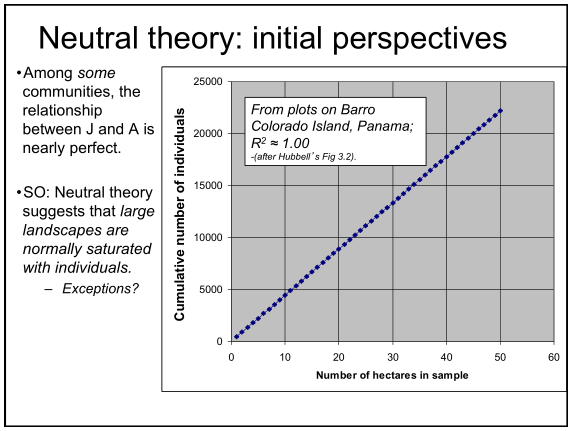
The following is an example from the scientific literature where r, the correlation coefficient, is approximately 1 (i.e., r ≈ 1).
Slide taken from the course BIO 4150 - Spatial Ecology, taught at the University of Ottawa by Dr. Jeremy Kerr.
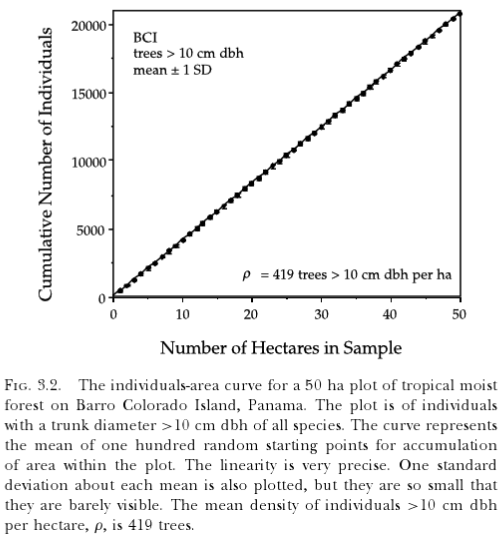
The plot shows the individuals-area curve from a 50 ha forest plot on Barro Colorado Island, Panama. The correlation between the number of individuals and the number of hectares sampled is nearly perfect. The figure is inspired by figure 3.2 in Hubbell (2001).
Figure reproduced from Hubbell (2001).
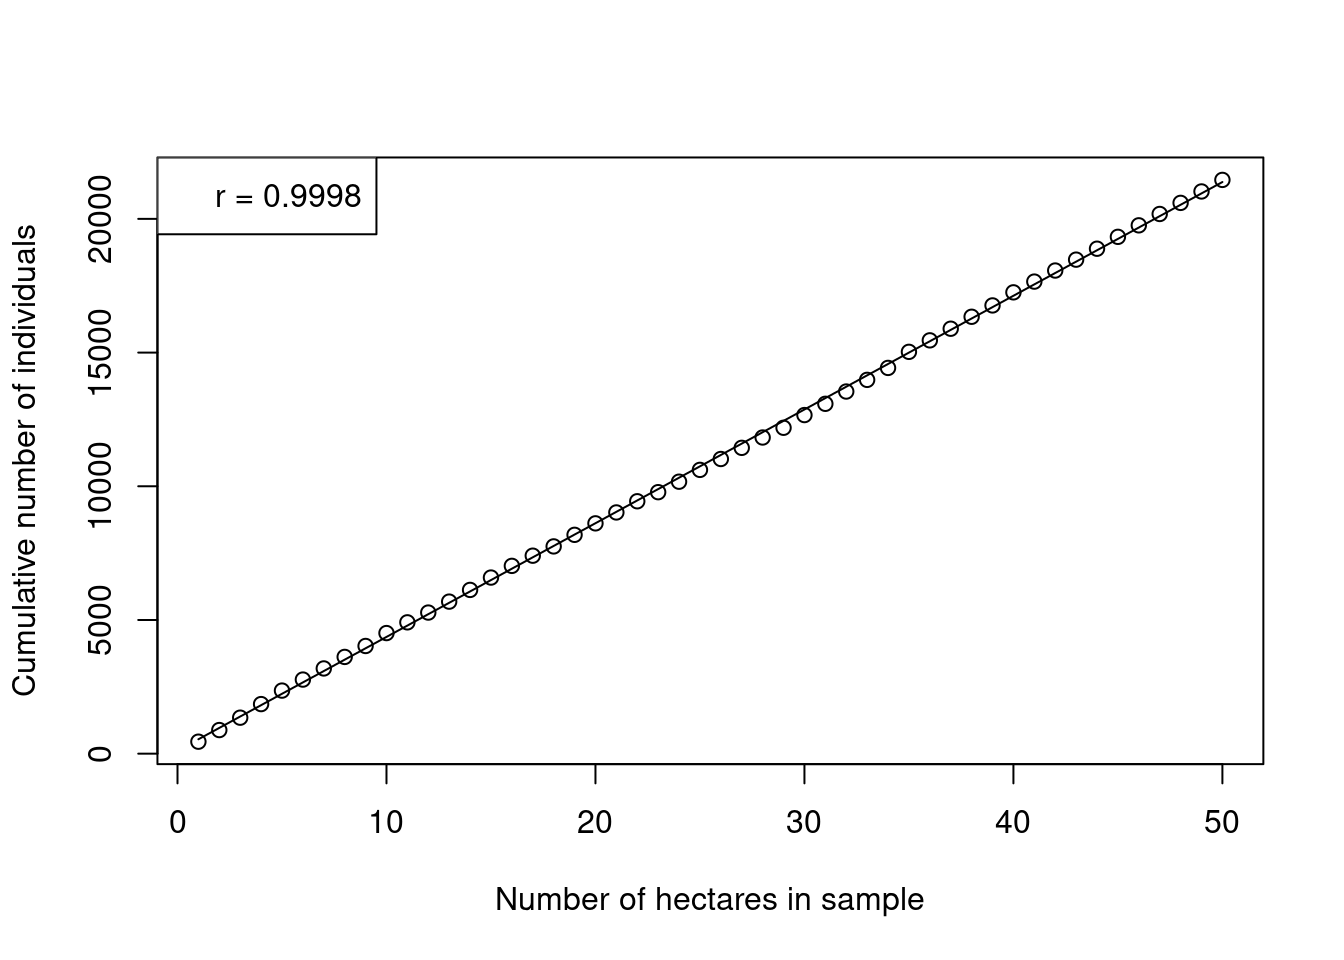
It is possible to reproduce this plot for ourselves using raw data from the R package vegan.
# load datalibrary(vegan)data(BCI)# preview data (first 5 hectares, first 5 species)BCI[1:5, 1:5]
# calculate the total number of individuals in each hectarerows <-rowSums(BCI)# calculate cumulative sum of individualssums <-cumsum(rows)# combine data for plottingdat <-data.frame(1:50, sums)colnames(dat) <-c('hectares', 'counts')# fit modelfit <-lm(dat$counts ~ dat$hectares)# plotplot(dat$counts ~ dat$hectares,xlab ='Number of hectares in sample',ylab ='Cumulative number of individuals')# add expected valueslines(x =1:50, y =predict(fit))# add correlation coefficientlegend("topleft", legend =paste0("r = ", round(sqrt(summary(fit)$r.squared), 4)))